Thomas Hardy’s Poetry of Unbelief

Hardy 2013

Wednesday 30th January 7.30pm
The Green House Hotel,  4 Grove Road, Bournemouth BH1 3AX

Bournemouth School’s former Head of English, John Hubbard shares his passion and enthusiasm for Hardy’s verse in this selection of readings with commentary.

Readings will include around twenty poems, both familiar and unfamiliar, including The Oxen, The Darkling Thrush, God’s Funeral and Afternoon Service at Mellstock. John’s selection has been chosen to illustrate Hardy’s relationship with the world in which he lived, and his developing unbelief.

We are expecting a highly enjoyable evening for devotees of Hardy’s works, as well as a great introduction for those coming to them for the first time.

Free entry (donations appreciated).     Everyone welcome!

(The Green House Hotel can also be accessed from Gervis Road, which is better lit and has roadside parking).

Please help us promote Dorset Humanists and this event by displaying an A4 poster. Download an A4 printable copy here, or email Dave at DHcensus(at)hotmail.co.uk for a PDF.

Click here to view details of other forthcoming and recent events on this website.

Census 2011: Was the 'What is your Religion?' question fatally flawed?

Was the 'What is your Religion?' question fatally flawed?
Yes! Say British Humanist Association.
No! Say Office of National Statistics.

Is 'What is your Religion?' a loaded question?

... the data on religion produced by the 2011 Census gives a misleading picture of the religiosity of the UK, despite the rise in the percentage of non-religious. This is because of the flawed nature of the Census question on religion. ‘What is your religion?’, the question which was used in England and Wales in the 2001 and 2011 Censuses, is a loaded question, because it assumes that the respondent has a religion. In addition, many respondents who answer this question by ticking a religion only do so because their family brought them up in that faith, not because they still believe in it or actively practice it. The data on religious belief in the Census should therefore be viewed as indicative of culture rather than of religion. 

The figures were probably also distorted by the fact that the question on religion appeared immediately after a series of questions on ethnicity, which may well have encouraged people to respond more on the basis of culture than actual beliefs or religious affiliation.

... Someone who loosely identifies themselves as Christian in a cultural sense might not necessarily agree with the idea of Christian organisations taking over public services in their area. Read more.

The British Social Attitudes, 2011 asked whether they regarded themselves as belonging to any particular religion, 44% of adults replied in the negative. This was a lower proportion than in 2010 (50%) but much higher than when the question had first been put in 1983 (31%).

However ONS argue (see below) that the word 'belonging' is also a loaded question. 'Belonging' implies a strong affiliation to a religion (ie signing up for a religion or going to church regularly).

Andrew Copson, CEO BHA called the Census 2011 figures 'astounding'. ‘This is a really significant cultural shift. In spite of a biased question that positively encourages religious responses, to see such an increase in the non-religious and such a decrease in those reporting themselves as Christian is astounding. Of course these figures still exaggerate the number of Christians overall – the number of believing, practicing Christians is much lower than this and the number of those leading their lives with no reference to religion much higher. Religious practice, identity, belonging and belief are all in decline in this country, and non-religious identities are on the rise. It is time that public policy caught up with this mass turning away from religious identities and stopped privileging religious bodies with ever increasing numbers of state-funded religious schools and other faith-based initiatives. They are decreasingly relevant to British life and identity and governments should catch up and accept that fact.’

The British Social Attitudes Survey 2010 

Religion - page 173 asked "Do you consider yourself as belonging to a particular religion"

One in three (31%) in 1983 did not belong to a religion, compared with one in two (50%) now.
The largest decline has been in affiliation with the Church of England, which has halved since
1983 (from 40% to 20%). This change – which is likely to continue – can be explained by generational replacement, with older, more religious, generations dying out and being replaced by less religious generations. There is little evidence that substantial numbers find religion as they get older. (source: BSAS 2010)

Why are we less religious than we used to be? 

BSAS 2010 says 'How can we explain this decline in religiosity? Here, we focus on the decline in religious affiliation, which we have seen is strongly influenced by being brought up in a religion, and links to levels of religious attendance. Does the decline in religious affiliation result from a lifecycle effect (with each individual generation’s attitudes following a particular pattern throughout their lifecycle), a period effect (with a particular event or way of thinking affecting all or some of society at a particular point in time) or a generation or cohort effect (with more religious generations dying and being replaced by less religious ones)? source: BSAS 2010, pg 181

To explore these possibilities, we grouped respondents into nine ‘generations’ and considered their levels of religious affiliation at four points in time. This analysis is presented in Table 12.7. source: BSAS 2010, pg 181


The first point to note is that there is no evidence of a lifecycle effect – that is, as people grow older they become more or less religious. Non-affiliation remains relatively stable as each generation ages; for example, 30 per cent of those born between 1936–1945 did not follow a religion in 1983 (when they were aged 38–47 years), compared with 31 per cent in 2010 (when they were 65–74 years). source: BSAS 2010, pg 181

Could the decline in religious affiliation be attributed to a period effect? At a time of plummeting trust in politicians and banks, might public cynicism have extended to religious bodies, perhaps spurred on by scandals within the church, such as the sex abuse scandal in the Roman Catholic Church in Ireland? There is some evidence of a decline in religious affiliation between 2000 and 2010, particularly for those generations currently aged in their mid-30s to mid-60s. This trend is likely to be very recent, as it has not been identified in previous work on this topic, and therefore merits further investigation. source: BSAS 2010, pg 181

However, by far the most marked differences occur between cohorts – indicating that the decline in religious affiliation in Britain has primarily been brought about by generational replacement. In 1983, for example, 55 per cent of those born between 1956 and 1965 (then aged 18–27) did not belong to a religion, compared with 12 per cent of those born before 1915 (then aged 68+). By 2010, 65 per cent of the youngest generation (born between 1986 and 1992 and then aged 18–24) did not belong to a religion, compared with 24 per cent of the oldest generation (born between 1926 and 1935 and then aged 75+6). The result of continual generational replacement is that, overall, the proportion of the population who does not belong to a religion continues to rise. source: BSAS 2010, pg 181

Graph by Chris Street

What do our findings mean for the future? We cannot, of course, rule out the possibility that a major event might affect people’s relationship with religion. But on the basis of our findings it seems likely that the ongoing decline in religious affiliation (and consequently religious attendance) will continue. This reflects the fact that each generation is less likely than its predecessor to be born into religious families, and that this lack of religiosity tends to remain with an individual as they get older. source: BSAS 2010, pg 181

Census 2001/2011 v British Social Attitudes - What is the difference in questions?

BSAS says in Note 1 'What is the difference between the proportions of the population identified as belonging to a religion by the 2001 census and British Social Attitudes can be partly explained by question wording: the census asks respondents “What is your religion?” – implying that the respondent has one – while the British Social Attitudes survey asks “Do you regard yourself as belonging to any particular religion?” The difference may also be due to the response options offered; with the census listing the major world religions, and British Social Attitudes listing specific denominations; respondents answering the former would be most likely to see this as a question concerned with ‘cultural classification’ rather than religion (Voas and Bruce, 2004). 


Finally, the context of the questions is significant, with the census question following one on ethnicity, arguably causing ‘contamination’ of responses (ibid.).' (source: BSAS 2010, note 1, pg 183)


NoelPlum99 

explains results of the Census 2011 and BSAS 2010 in his Youtube video (13m) which I recommend as a summary of Census 2011 and why the Census 2001 and 2011 question 'What is your religion', only looks at Religious Affiliation and NOT whether people believe in God.

I posted this in reply to his video:-

'@ 4.47
- Census 2011 'What is your religion?".What is it trying to find out? 59% Christians does NOT mean they believe in God!
@ 5.11
ONS say in their Youtube video 0-18secs "This is a short video looking at religion in England and Wales. Using these people we will look at the breakdown of Religious Affiliation; how we connect or identify with a religion, irrespective of actual practise or belief". On the ONS site they also say "Religion is a many sided concept and there are other aspects of religion such as religious belief, religious practice or belonging which are not covered in this analysis" (source: ONS)

Social connection is what interests them NOT whether you believe in god(s), or not.


@6.44
BNAS 2010 Religious Affiliation table 12.1 "Do you regard yourself as belonging to a particular religion? Result: 50% Irreligiosity.
@10.55s
Table 12.7 explains cohort reason. viz. as new generations come along, fewer of the cohort believe in God'

What options for the Religion question did ONS consider?

ONS published a 'Final recommended questions 2011 - Religion' a comprehensive 57 page pdf listed here.

ONS say there are a number of dimensions to the concept of religion, the key ones for survey and census questions being affiliation, practice and belief. Based on the evidence of a lengthy programme of research and consultation, ONS believes that the most appropriate question for the 2011 Census, that best meets user needs, is one that asks about religious affiliation.

Several different question wordings have been tested, including:
• What is your religion?
• What is your religion or belief?
• What is your religion, even if not currently practising?
• Do you regard yourself as belonging to a religion?
• Which of these best describes you?

Testing found that the question ‘what is your religion?’ best meets the requirement of collecting good quality data on religious affiliation within the space constraints of the census questionnaire. The question will also provide comparability between the 2001 and 2011 Censuses.

The question did not attempt to collect detailed information about the nature of their belief or the extent to which people practice their religion. Although questions on belief are asked in the British Social Attitudes Survey and the British Household Panel Survey, they are not seen as appropriate or acceptable for a census and nor would they meet the needs of most users of census data. (source: 'Final recommended questions 2011 - Religion', pg 9)

Do you regard yourself as belonging to a religion?

ONS chose not to use the BSAS question ('Final recommended questions 2011 - Religion', pg 25-27):- Do you regard yourself as belonging to a religion? The term ‘belonging’ is used in the literature to refer to both strong affiliation and regular churchgoing. It may be that this conflation occurs in the minds of respondents too. Differences in the proportion of religious affiliates between the census (‘what is your religion?’) and the BSA (‘Do you regard yourself as belonging to a particular religion?’) may be partly explained if people are more likely to understand the latter in terms of active belonging – that is, as requiring membership of a church or other practising religious group, reducing the number identifying as such (Voas and Bruce 2004).

What do BHA think about the 'What is your religion' question?

BHA - New survey evidence: census religion question ‘fatally flawed’.

click for large image


Census 2011: In Dorset the non-religious population has almost doubled in ten years.

The Census 2011 results (see Figure 3) show that South West England is the least religious in England with 29.3% non-religious ... the England average is 24.7% (see table below).

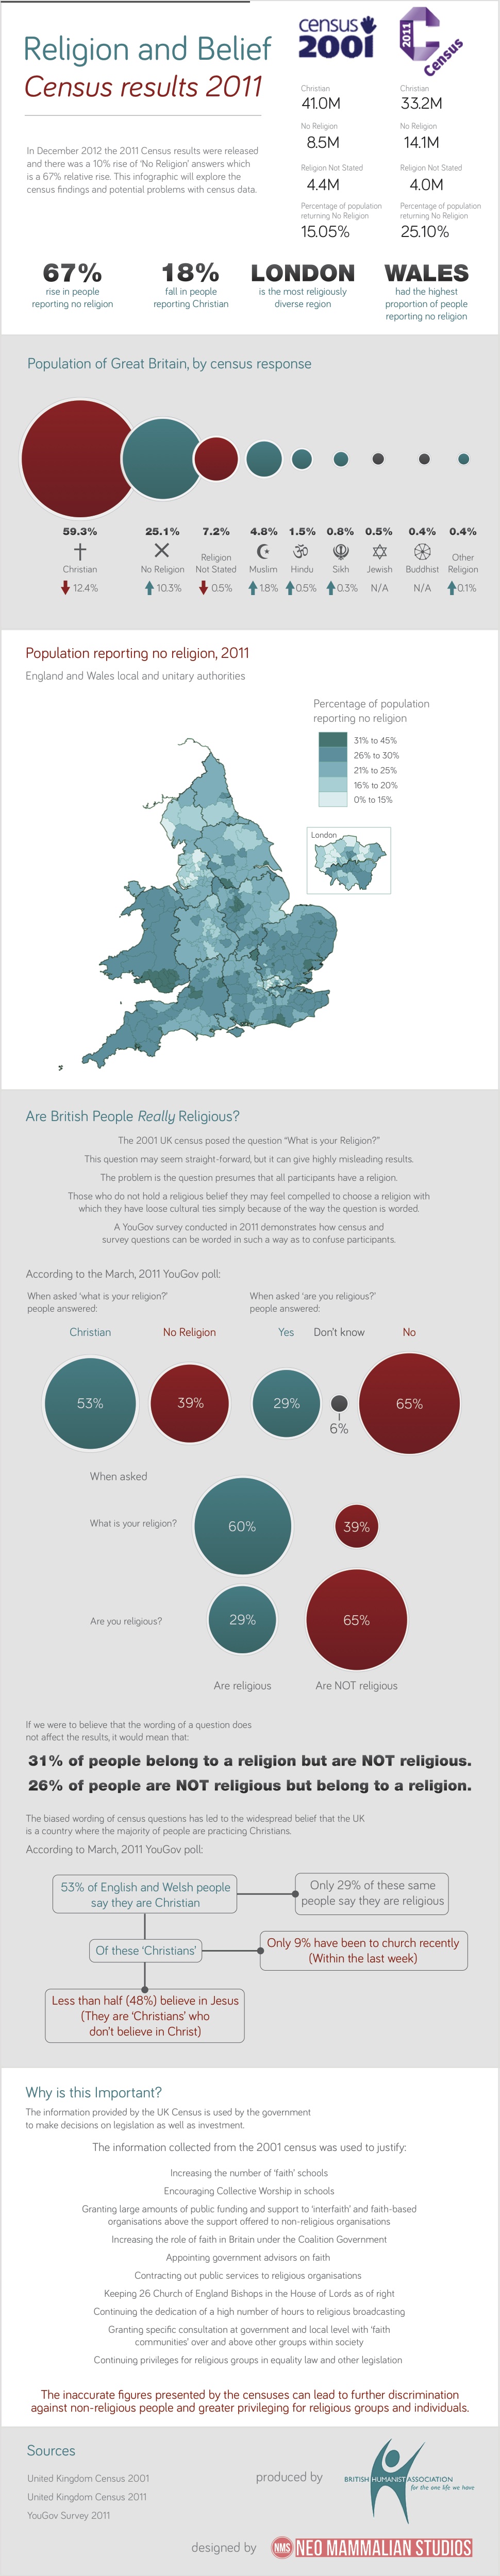
Census results just published show a plunge in the number of people ticking ‘Christian’ in England and Wales from 72% in 2001 to 59% in 2011 (see Figure 4 below) and an increase in the number of people ticking to say they have no religion from 15% in 2001 to 25% in 2011. (see Figure 1 & 2).

Chris Street
Chris Street (Education Officer, Dorset Humanists - see right) analyses the results of the Census 2011 & 2001 question 'What is your religion?' for England & Wales, then drills down to South West England & Dorset including Bournemouth and Poole.

The 'What is your religion?' question gives data on 'religious affiliation' not religious belief in God or religious practise or observance (see 'Is the question 'What is your Religion?' fatally flawed?  post).

Thanks to Dave E for providing Table 1:-


Area name
Local Authority
Area 
Christian
Christian
No religion
No religion


%
%
%
%


2001 2011 2001 2011
ENGLAND AND WALES

71.75 59.3 14.81 25.1
ENGLAND

71.74 59.4 14.59 24.7
SOUTH WEST

73.99 60.4 16.75 29.3

Bournemouth UA
70.91 57.1 17.94 30.5

Poole UA
74.34 60.4 16.23 29.7

Dorset
77.88 65.3 13.74 25.2


Christchurch 79.06 67.1 13.18 23.6


East Dorset 79.90 66.8 12.61 24.2


North Dorset 77.75 66.5 13.61 23.8


Purbeck 78.36 65.0 13.81 25.9


West Dorset 77.55 65.3 13.61 25.0


Weymouth & Portland 74.67 61.0 15.89 29.3

Table 1: England & Wales, South West, Dorset: % Christian & No religion.


Figure 1: Religious Affiliation, England and Wales 2011
source: ONS

England and Wales - Census 2011

The England & Wales 2011 religious census data was released 11 December 2012 by the Office of National Statistics (ONS) :-

Census 2001 v 2011 in England & Wales

Compared with the 2001 Census the most significant trends (see Figure 2 & 3 below) of Census 2011 were:-
  • an increase in the population reporting no religion – from 14.8 per cent of the population in 2001 to 25.1 per cent in 2011, an increase of 70 per cent
  • a drop in the population reporting to be Christian - from 71.7 per cent in 2001 to 59.3 per cent in 2011, a decrease of 17 per cent
  • an increase in all other main religions. The number of Muslims increased the most from 3.0 per cent in 2001 to 4.8 per cent in 2011
  • For every 4 Christians (48%) there is 1 Muslim (12.4%) in London
  • The South West (29.3%) is the least non-religious region in England


Figure 2: Change in Religious affiliation, 2001 - 2011, England and Wales
source: ONS


Figure 3: Religious affiliation, England regions and Wales 2011 Census
source: ONS

In comparison with 2001,
  • the proportion reporting no religion increased across all regions – ranging from 5.0% in London to 13.6% in Wales (see Figure 5)
  • Christian affiliation fell across all regions – ranging from 9.8% in London to 14.3% in Wales (see Figure 4)
  • London had the largest increase of Muslims (3.9%) and Hindus (1.0%)

Figure 4: Christians % 2001 v 2011 Religious affiliation
Click map to enlarge. Interactive map - search by postcode - compare 2001 v 2011 in your area

In England & Wales the population over the last 10 years has increased from 52M to 56.1M, a 7.7% increase. The non-religious have increased from 7.7M to 14M, an 82% increase. The non-religious now account for 25.1% of the population up from 14.8% in 2001. Christians have decreased from 37.3M to 33.2M, a 10.9% decrease from 71.7% of the population in 2001 to 59.3% in 2011. Muslims have increased from 3% to 4.8% of the population. (see Figure 6)


Figure 5: No Religion % 2001 v 2011. 
Click map for larger image. Interactive map - search by postcode - compare 2001 v 2011 in your area


Figure 6: Census 2011 v 2001 England & Wales 
Interactive map - search by postcode - compare 2001 v 2011 in your area

South West England

Dorset CC, Bournemouth UA and Poole UA are part of South West England. Poole UA is typical of the South West in changes in religious affiliation since 2010.

The South West (see Figure 7) is the least non-religious region in England (29.3%). Wales had the highest proportion of people reporting no religion at nearly a third of the population (see Figure 3).

Note: Other regions of South West England are:- Bath and North East Somerset UA, City of Bristol UA, North Somerset UA, Plymouth UA, Gloucestershire, Somerset and Wiltshire.


Figure 7: Census 2011 v 2001 - Religion and No Religion in South West


In March 2011 prior to the 27 March 2011 Census, Dorset Humanists campaigned in Dorset and the British Humanist Association campaigned in England & Wales asking people to tick the 'No Relgion' box in the Census, if they were not religious.

Dorset Humanists Census Campaign included leafleting in Bournemouth Square, paid ads in Dorset newspapers and on Facebook.

Census 2011: the County of Dorset


Figure 8: Numbers with No religious affiliation in Dorset 2001 v 2011

The Bournemouth UA, Poole UA and Dorset CC (see below) combined regions gives the County of Dorset ('Dorset') figures. Numbers of non-religious people in 'Dorset' has increased from 15.2% in 2001 to 27.4% in 2011 (see Figure 15).

On Census Day 2011, Dorset had a population of 744,041 with 204,054 people of 'No religion' up from 105,495 in 2001.

In Dorset the non-religious have almost doubled (+93%) in numbers from 105,495 in 2001 to 204,054 in 2011. That's a whopping ~100,000 more non-religious people living in Dorset today compared to 2001! (see Figure 8)

In 2011 62.3% and in 2001 75.5% of Dorset population were Christians. Although the Dorset population has grown by 7.4% or 51,329 (744,041 in 2011, 692,712 in 2001), the number of Christians in Dorset has reduced by 11.3% or 59,383 (463,808 in 2011; 523,191 in 2001). (Figure 9)


Figure 9: Census 2011 v 2001 Religion and No Religion in the County of Dorset

Bournemouth

In 2011 55,911 or 30.5% of the Bournemouth Unitary Authority (UA) 183,491 population were non-religious.

This represents a 70% increase in % non-religious people compared to 2001 when 29,326 or 17.9% of the Bournemouth UA 163,444 population were non-religious (see graph below).

In Bournemouth there are now almost double the number of non-religious people (+90%) in 2011 (55,911) compared to 2001 (29,326).

In 2011 57.1% and in 2001 70.9% of the Bournemouth population were Christians. Although the Bournemouth population has grown by 12% or 20,047 (183,491 in 2011, 163,444 in 2001), the number of Christians in Bournemouth has reduced by 10% or 11,065 (104,828 in 2011, 115,893 in 2001) (see Figure 10).


Figure 10: Census 2011 v 2001 Religion and No Religion in Bournemouth, Dorset


Figure 11: Map of No Religion % in Bournemouth 2001 v 2011. 
Click for larger clearer image
Interactive map - search by postcode - compare 2001 v 2011 in your area

As a bit of an aside, the least religious places in England & Wales are Norwich (42.5%) and Brighton & Hove UA (42.4%). In Bournemouth, 30.5% of the population is non-religious. Thus Bournemouth is 43rd (out of 348) of the least religious places to live in England and Wales (see Figure 12).


Figure 12: Top 50 least religious places in England & Wales 2011
1) Norwich 2) Brighton and Hove ... 43) Bournemouth

Poole

In 2011 43,922 or 29.7% of the Poole Unitary Authority (UA) 147,645 population were non-religious. 

This represents an 83% increase in % non-religious people compared to 2001 when 22,442 or 16.2% of the Poole UA ('Poole') 138,288 population were non-religious (see graph below).

In Poole there are now almost double the number of non-religious people (+ 95.7%) in 2011 (43,922) compared to 2001 (22,442).

In 2011 60.4% and in 2001 70.4% of the Poole population were Christians. Although the Poole population has grown by 6.7% or 9,357 (147,645 in 2011, 138,288 in 2001), the number of Christians in Poole has reduced by 13.1% or 13,555 (89,243 in 2011, 102,798 in 2001) (see Figure 13).


Figure 13: Census 2011 v 2001, Religion and No Religion in Poole, Dorset


Figure 14: Census 2001 v 2011 No Religion % map of Poole. 
Click map for larger clearer image. 
Interactive map - search by postcode - compare 2001 v 2011 in your area

Dorset County Council

In 2011 104,221 or 25.2% of the Dorset County Council (CC) 412,095 population were non-religious.

This represents a 92% increase in % non-religious people compared to 2001 when 53,727 or 13.1% of the Dorset CC 390,980 population were non-religious (see Figure 15).

In Dorset CC there are now almost double the number of non-religious people (+94%) in 2011 (104,221) compared to 2001 (53,727).

Dorset CC includes the Borough councils of Christchurch, Weymouth and Portland and the District councils of East Dorset, North Dorset, Purbeck, West Dorset (see Figures 15 & 16).

In 2011 65.3% and in 2001 77.9% of the Dorset CC population were Christians. Although the Dorset CC population has grown by 5.4% or 21,115 (412,095 in 2011, 390,980 in 2001), the number of Christians in Dorset CC has reduced by 11.4% or 34,763 (269,737 in 2011, 304,500 in 2001).

The Census 2011 Religion data (Excel table: KS209EW) was released on 11 December 2012. I compare 2011 data to the archived 2001 Census data (see Excel table: KS07) (see Figure 15).

Read more in Dave Es' 11 December post.


Figure 15: Dorset 2001 v 2011 % No Religion by District or Borough Council


Figure 16: County of Dorset map split by District and Borough Councils.
Surrounding Counties: A =  Devon, B = Somerset, C = Wiltshire, D = Hampshire


Figure 17: Census 2011 v 2001 Religion and No Religion in Dorset County Council


Figure 18: Census 2001 v 2011. No religion % in Christchurch, Dorset. 
Click map for larger clearer image. 
Interactive map - search by postcode - compare 2001 v 2011 in your area


Figure 19: Change in non-religious and Christians in Dorset 2001 to 2011


Figure 20: Population of England and Wales by census response 2011
source: BHA

2011 Census Results: Dramatic Rise in Dorset’s Non-religious

Census01 According to results from the 2011 Census released today there was a big fall in those self-identifying as ‘Christian’ across England and Wales, and the proportion of people who reported they have no religion has now reached a quarter of the population.

Figures for our region are split by local authority and are as follows:
Bournemouth: 71% ‘Christian’ in 2001 dropped to 57% ‘Christian’ in 2011, and 18% ‘No Religion’ in 2001 rose to 30% No Religion’ in 2011.
Poole: 74% ‘Christian’ in 2001 dropped to 60% ‘Christian’ in 2011, and 16% ‘No Religion’ in 2001 rose to 30% No Religion’ in 2011.
Dorset (includes Christchurch, East Dorset, North Dorset, Purbeck, West Dorset, Weymouth & Portland): 78% ‘Christian’ in 2001 dropped to 65% ‘Christian’ in 2011, and 14% ‘No Religion’ in 2001 rose to 25% No Religion’ in 2011.
Detailed ONS 2011 Census religion statistics can be downloaded from: http://www.ons.gov.uk/ons/rel/census/2011-census/key-statistics-for-local-authorities-in-england-and-wales/rft-table-qs210ew.xls

It’s worth noting once again that the optional religion question in the 2011 Census was framed to identify religious affiliation which doesn’t necessarily indicate belief or practice. For comparison, the results of the 29th British Social Attitudes Survey (BSA), published in September 2012, found 45.7 per cent of respondents claimed not to belong to a religion.

The British Humanist Association’s CEO Andrew Copson had this to say about the results:
‘This is a really significant cultural shift. In spite of a biased question that positively encourages religious responses, to see such an increase in the non-religious and such a decrease in those reporting themselves as Christian is astounding. Of course these figures still exaggerate the number of Christians overall – the number of believing, practicing Christians is much lower than this and the number of those leading their lives with no reference to religion much higher.
 ‘Religious practice, identity, belonging and belief are all in decline in this country, and non-religious identities are on the rise. It is time that public policy caught up with this mass turning away from religious identities and stopped privileging religious bodies with ever increasing numbers of state-funded religious schools and other faith-based initiatives. They are decreasingly relevant to British life and identity and governments should catch up and accept that fact.’ (Read more here).

The ONS has a useful summary page on the religion results, including an animated video, here:
The 2011 Census results are summarised below (Other religions and ‘not stated’ not shown).
Area name
Local Authority
Area
Christian
Christian
No religion
No religion


Percentage
Percentage
Percentage
Percentage
2001 2011 2001 2011
ENGLAND AND WALES 71.75 59.3 14.81 25.1
ENGLAND 71.74 59.4 14.59 24.7
SOUTH WEST 73.99 60.4 16.75 29.3
Bournemouth UA 70.91 57.1 17.94 30.5
Poole UA 74.34 60.4 16.23 29.7
Dorset 77.88 65.3 13.74 25.2
Christchurch 79.06 67.1 13.18 23.6
East Dorset 79.90 66.8 12.61 24.2
North Dorset 77.75 66.5 13.61 23.8
Purbeck 78.36 65.0 13.81 25.9
West Dorset 77.55 65.3 13.61 25.0
Weymouth & Portland74.6761.015.8929.3

‘A quarter of responses to any question on religion are unreliable’

A recent report by the Centre for Longitudinal Studies (CLS) entitled, 'The art of asking questions about religion' demonstrates just how significantly the results of religiosity surveys (including the National Census) are influenced by the particular framing of the questions asked.

The report concludes:

‘A review of methods of measuring religious involvement suggested that “the following ‘law’ is at least semi-serious: a quarter of responses to any question on religion are unreliable” (Voas 2007b: 133)’. 

and

‘Apparently small differences in question wording can lead to dramatic differences in responses’.

Of particular relevance to the 2011 Census results due out tomorrow is the report’s finding that:

‘Religious affiliation does not imply belief in God, let alone participation in religious services or meetings, and for some respondents may just reflect a cultural default or quasi-ethnic identity. Indeed it is unclear how questions on religious affiliation should be interpreted. What does ‘belonging to’ a religion actually mean? It is very likely to mean different things to different respondents. This ambiguity is important in the context of the UK Census question on religion, which pertains to religious affiliation, given that the Census is intended as a tool for planning public service provision. Repeated efforts to stress that people are asked about affiliation, rather than practice or belief, has not stopped even expert commentators from muddling the concepts’.

Download the report here: http://www.cls.ioe.ac.uk/shared/get-file.ashx?itemtype=document&id=1557

Although it refused to replace the 2011 Census religion question for England and Wales with one of a less leading nature, the ONS does stress that Census data on religious affiliation should be presented along with the following clarification:

‘Respondents were asked the question, ‘What is your religion?’ which measures affiliation - that is the identification with a religion irrespective of actual practice or belief’.

http://www.ons.gov.uk/ons/guide-method/measuring-equality/equality/ethnic-nat-identity-religion/religion/presentation-of-religion-data.html

Unfortunately, our experience is that this instruction is rarely complied with, even by representatives of national and local government.